Untangling a bizarre WASM crash in Chrome
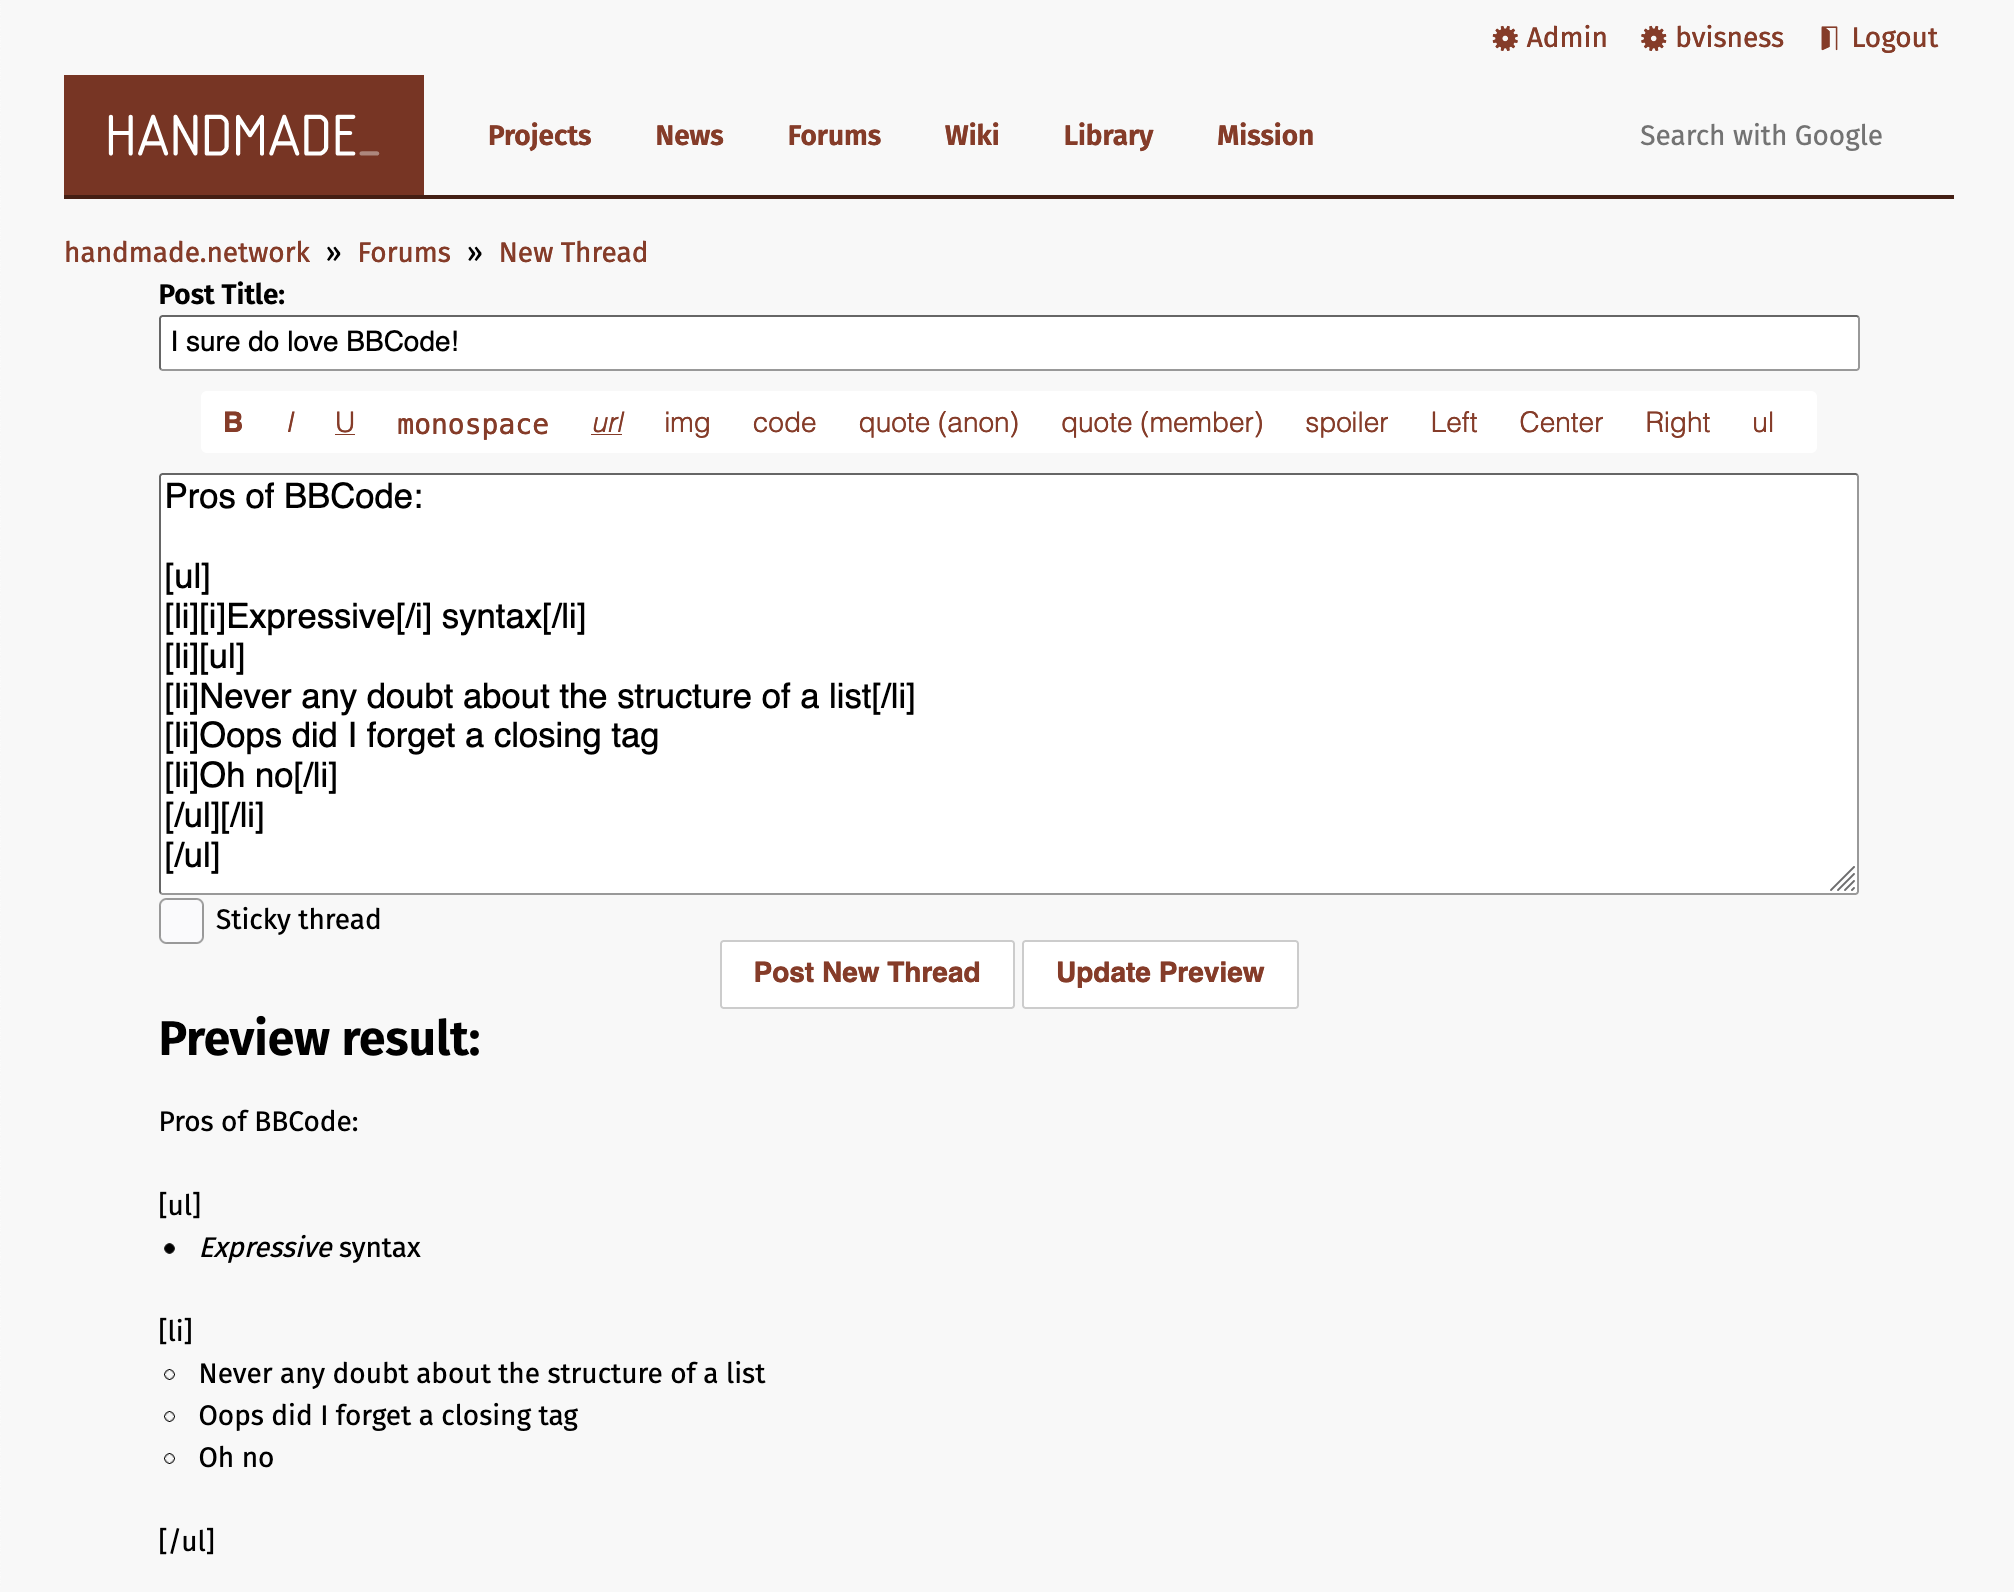
We're currently rewriting the Handmade Network website in Go. As part of this, we're taking the opportunity to revamp the old, dated forum post editor, which still doesn't have Markdown support, and only supports BBCode.

Yep.
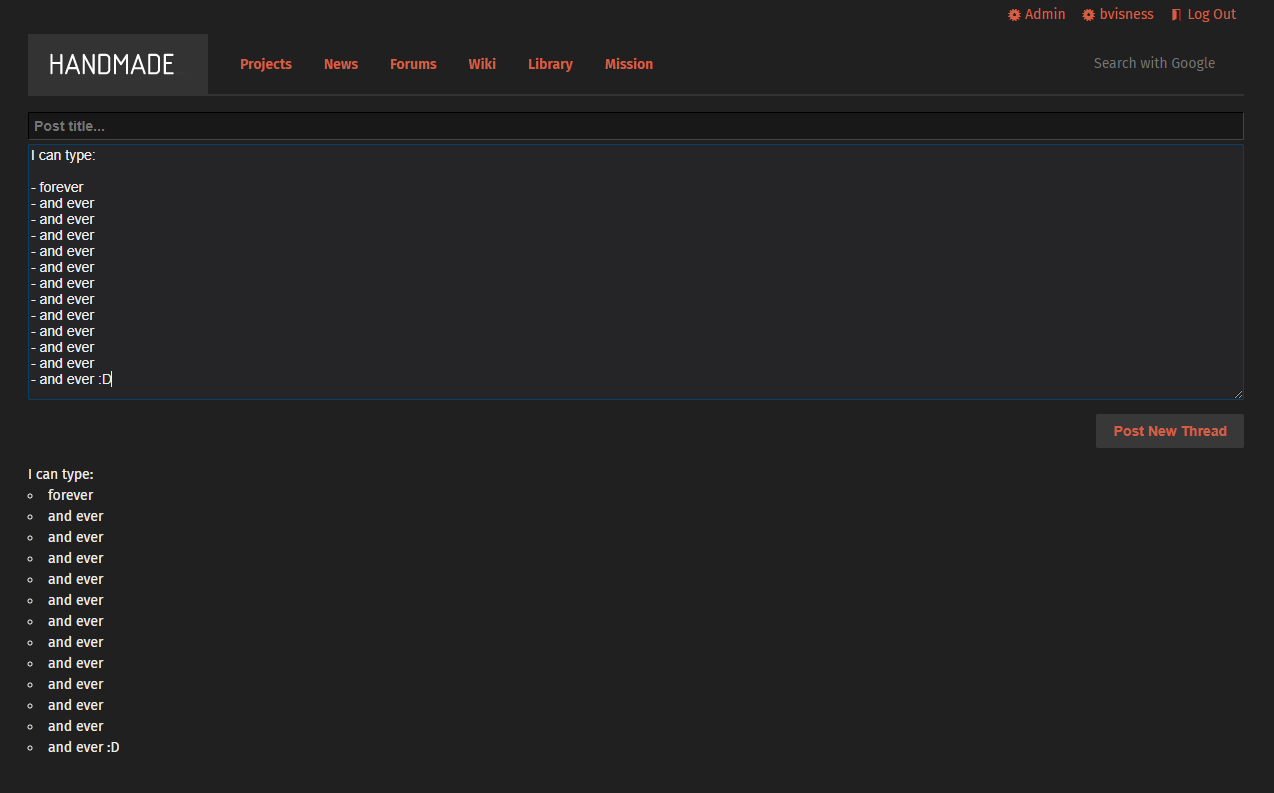
Besides Markdown, one of the things we found we wanted right away was real-time previews. There's no reason these days to make a round-trip to the server just to preview some formatted text. We were able to just compile our server-side Markdown-parsing code to WebAssembly and run it on the client. This worked really well! There was only one snag:
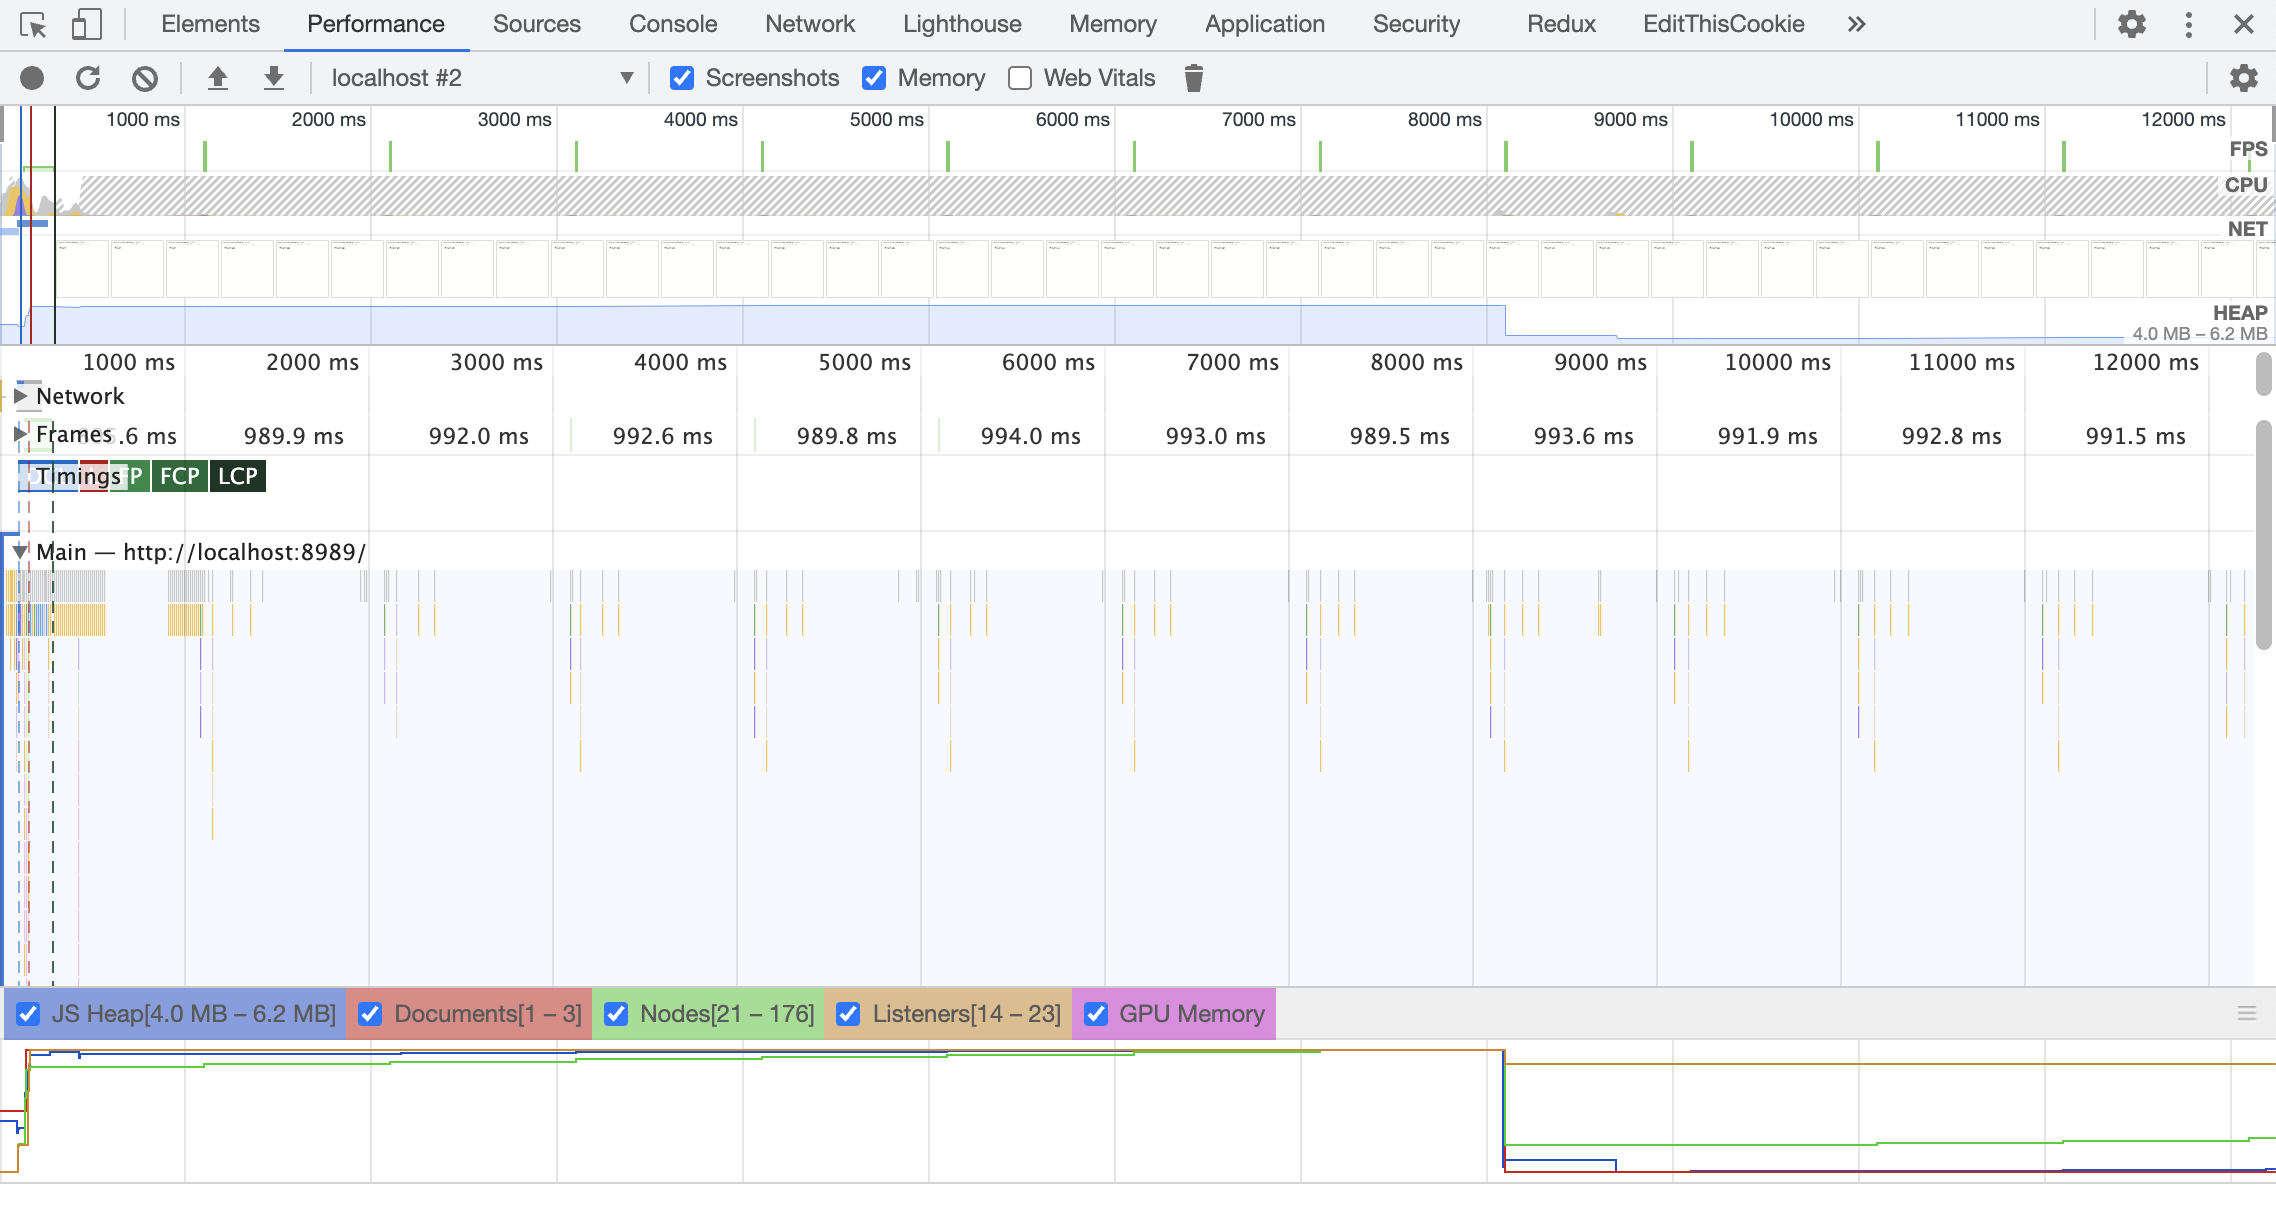
This crash didn't make a lot of sense. It says the tab is out of memory, but this occurs even if you never interact with the page. In fact, if you profile the page, it's clear that no user code is running. The heap size isn't even growing. So how could we be running out of memory?

Commenting out most of the Go code made the issue go away, so it was clear that something in our WASM was the culprit. But with no code running, how could that be? Furthermore, the page was interactive and real-time previews were working, so the WASM code was definitely running. What could be the culprit?
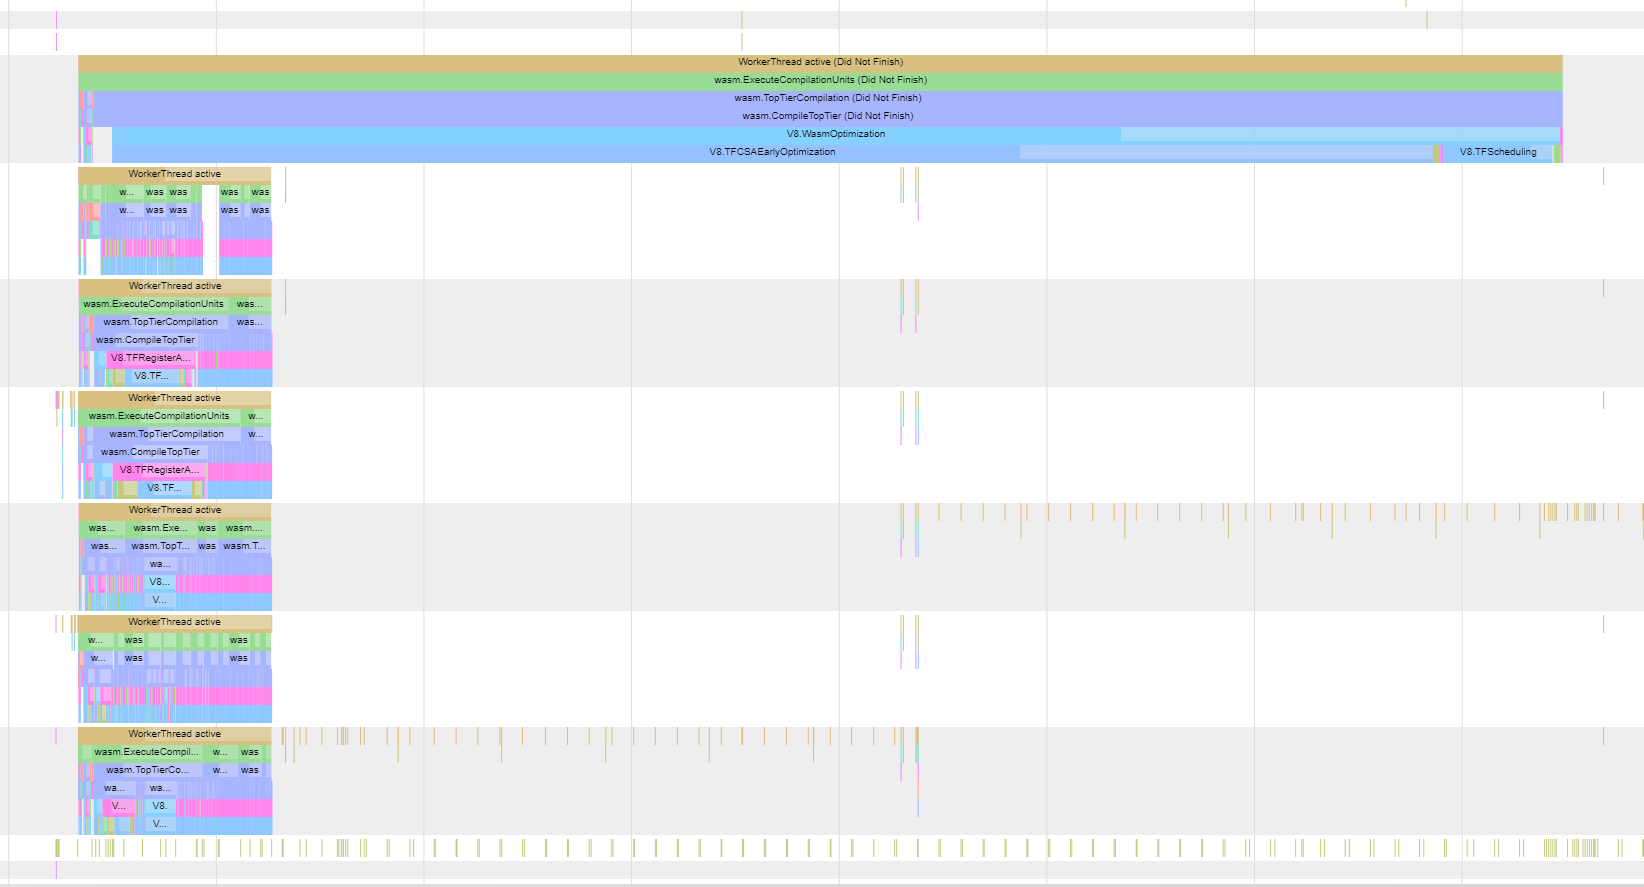
On a recent episode of the Handmade Network podcast, Asaf reminded me that Chrome actually has another profiler, which can profile Chrome itself. Since it didn't look like our code was directly causing any problems, it felt like that was worth a shot. It took some fiddling to figure out which categories were relevant, but eventually we turned up something interesting:

This was clearly the problem. It was related to WASM, and it was the only thing running in the browser at the time of the crash. From function names like wasm.CompileTopTier and V8.WasmOptimization, it was clear that optimization was to blame somehow. But we were confused - the code was clearly already compiled. The WASM code was running successfully, after all.
After a little digging, Asaf found the section of code that was actually crashing. The internals of V8 are a bit much for us to follow, but from context we were able to glean that it was part of a system called "TurboFan". We looked it up and it turns out TurboFan is a compiler within V8 that is designed to heavily optimize code (both WebAssembly and JavaScript) after the initial JIT has finished.
This is an interesting principle in V8 and one I didn't realize applied to WASM as well as JavaScript. This page breaks down the process further, but the quick version is that V8 actually has multiple JIT compilers optimized for different things. The first compiler, known as Liftoff, is designed to get code up and running quickly, with few optimizations. After Liftoff has finished and the page is interactive, TurboFan kicks in and recompiles everything at a high level of optimization, replacing the Liftoff results as it goes. The result is that the user can see results very quickly, but also have excellent performance overall. It's a smart design.
But clearly something was wrong. Many of the slow functions had "TF" in the name, clearly referring to TurboFan. We also tested the page with TurboFan turned off and the problem disappeared. So we knew that optimization was to blame. But now we had more questions: which function was actually causing TurboFan to explode? And why?
Trying to analyze the WASM file directly wasn't fruitful; at 15MB, it took way too long to convert to the textual format through wasm2wat, and even when I did get parts of it converted, I didn't learn much. (I learned later that I could use wasm-objdump to help, but at the time I didn't know this.) I ended up resorting to trial and error within the Go code, importing specific packages and commenting things out until I found the cause.
This was the cause, and this was just a small section of the resulting WebAssembly (in textual form):
var html5entities = map[string]*HTML5Entity{
    "AElig":  {Name: "AElig", CodePoints: []int{198}, Characters: []byte{0xc3, 0x86}},
    "AMP":    {Name: "AMP", CodePoints: []int{38}, Characters: []byte{0x26}},
    "Aacute": {Name: "Aacute", CodePoints: []int{193}, Characters: []byte{0xc3, 0x81}},
    "Acirc":  {Name: "Acirc", CodePoints: []int{194}, Characters: []byte{0xc3, 0x82}},
    "Acy":    {Name: "Acy", CodePoints: []int{1040}, Characters: []byte{0xd0, 0x90}},
    "Afr":    {Name: "Afr", CodePoints: []int{120068}, Characters: []byte{0xf0, 0x9d, 0x94, 0x84}},
    "Agrave": {Name: "Agrave", CodePoints: []int{192}, Characters: []byte{0xc3, 0x80}},
    "Alpha":  {Name: "Alpha", CodePoints: []int{913}, Characters: []byte{0xce, 0x91}},
    // approximately 2000 more entries
}
This code was from our Markdown library, Goldmark. It's no wonder TurboFan has a hard time optimizing this; this is just a small fraction of the blocks present in this function. I knew from some prior work that blocks were part of how WASM handles branches and jumps, but why was this code so branchy at all? Why would there be any branches when you're just initializing a map?
Answering this question will require us to dig into the Go compiler a little bit, and look at the assembly it generates.
Here's a small example of the assembly Go generates for a map. I've heavily edited the assembly for clarity, including deleting a bunch of code that didn't seem relevant, so know that this only shows the general structure.
package main

func main() {}

var myMap = map[string]string{
    "foo": "bar",
    "baz": "bing",
    "beep": "boop",
}
init:
CALL runtime.makemap_small(SB) # make the map
LEAQ go.string."foo"(SB), DX
CALL runtime.mapassign_faststr(SB) # make key "foo"
CMPL runtime.writeBarrier(SB), $0 # check if GC is active
JNE init_key_foo_gc # if GC active, jump down to init_key_foo_gc
LEAQ go.string."bar"(SB), AX # write "bar" normally
init_key_baz:
LEAQ go.string."baz"(SB), DX
CALL runtime.mapassign_faststr(SB) # make key "baz"
CMPL runtime.writeBarrier(SB), $0 # check if GC is active
JNE init_key_baz_gc # if GC active, jump down to init_key_baz_gc
LEAQ go.string."bing"(SB), AX # write "bing" normally
init_key_beep:
LEAQ go.string."beep"(SB), CX
CALL runtime.mapassign_faststr(SB) # make key "beep"
CMPL runtime.writeBarrier(SB), $0 # check if GC is active
JNE init_key_beep_gc # if GC active, jump down to init_key_beep_gc
LEAQ go.string."boop"(SB), AX # write "boop" normally
MOVQ AX, "".myMap(SB) # finalize the map normally
init_return:
RET # return!
init_key_beep_gc:
LEAQ go.string."boop"(SB), AX
CALL runtime.gcWriteBarrier(SB) # tell GC to write "boop"
LEAQ "".myMap(SB), DI
CALL runtime.gcWriteBarrier(SB) # tell GC to finalize the map
JMP init_return # jump up to init_return
init_key_baz_gc:
LEAQ go.string."bing"(SB), AX
CALL runtime.gcWriteBarrier(SB) # tell GC to write "bing"
JMP init_key_beep # jump up to init_key_beep
init_key_foo_gc:
LEAQ go.string."bar"(SB), AX
CALL runtime.gcWriteBarrier(SB) # tell GC to write "bar"
JMP init_key_baz # jump up to init_key_baz
If you follow all the jumps, you'll see that control flow is not exactly straightforward! If the GC is active at some point during this initialization, then the code could potentially jump all over the place.
Importantly for us, notice that Go generates multiple chunks of assembly for each entry of the map. Each entry gets the normal straightforward path, and the GC-active path, with two extra jumps as a result.
Now recall that we have over 2000 map items.
The situation for us is even worse. Go seems to do this branching pattern for each memory allocation the GC needs to know about. This map of HTML entities has several of those - in addition to the map entries themselves, the structs have slices in them that are also allocated in this branchy way. So each map entry actually has six sections of assembly, and six branches.
Normally I expect all this branching isn't a problem. CPUs won't have any trouble following these JMP instructions, and based on some conversations on the Handmade Network Discord, I suspect that the assembly is structured this way to result in good branch prediction for the typical case where the GC is inactive. But WebAssembly is different. All branches must be expressed in a structured way using the block, if, and loop instructions (spec). There are several good reasons for this. However, I don't think the authors of V8 expected to ever see so many nested blocks.
At this point Asaf suggested that we could fork Goldmark and initialize this map in a more efficient way. If we could find a way to avoid having so many branches, V8 would probably be happy.
Turns out he was right! We turned the map literal into an array literal, and then looped over it on startup to create the map, like so:
package main

func main() {}

// An HTML5Entity struct represents HTML5 entitites.
type HTML5Entity struct {
    Name       string
    CodePoints []int
    Characters []byte
}

var html5entities map[string]*HTML5Entity

func init() {
    html5entities = make(map[string]*HTML5Entity, len(html5entities))
    for _, entity := range html5entitieslist {
        html5entities[entity.Name] = &entity
    }
}

var html5entitieslist = [...]HTML5Entity{
    {Name: "AElig", CodePoints: []int{198}, Characters: []byte{0xc3, 0x86}},
    {Name: "AMP", CodePoints: []int{38}, Characters: []byte{0x26}},
    {Name: "Aacute", CodePoints: []int{193}, Characters: []byte{0xc3, 0x81}},
    // and all the rest
}
This approach resulted in much smaller generated code: just the few branches required for the loop, with one GC management section. All of the data was now in the data section of the WASM file instead of hardcoded into the assembly. Not only did this immediately solve our problem, but it actually made our WASM file smaller by two full megabytes!

This experience for me perfectly captures what is so powerful about the Handmade ethos. Asaf and I ran into a bizarre problem with no apparent cause. But through our combined knowledge, our willingness to dig deep into the underlying layers, and our experience doing so, we were able to solve our problem in just a few hours. And this in the constantly-vilified world of web development, no less!
Of course, it would be nice for this situation to not come up again in other places. While I'm not exactly sure what the best fix would be, I have a couple ideas:
-
V8 could bail out of optimization if it detects that a function is too complex or is using too many resources. Since the one-pass baseline compiler doesn't seem to struggle with this workload, I think it should be able to skip optimization on select functions and continue using the baseline version.
Alternatively, it may be possible to optimize TurboFan to use less memory here, but I have exactly zero knowledge about whether this is possible or feasible.
A Chromium issue can be found here.
-
Go could generate fewer nested blocks in its WASM code. My hunch is that WASM optimizers struggle more with deep functions than long functions, and from what I understand of Go's process, I think the generated WASM could be very flat.
Basically, Go seems to turn all jumps into
blockandloopinstructions (for forward and backward jumps respectively). But in this case,ifinstructions (andelse) could be used for the GC sections, with no backward jumps required at all. This could result in very shallow WASM.However, based on my knowledge of Go's compilation process (especially its custom assembler), this may be easier said than done.
A GitHub issue can be found here.
Of course, both of these ideas could be wrong. But I hope that the issue can somehow be mitigated so that it doesn't bite other people in the future!